

Cryptocurrencies, including Bitcoin, often experience sharp movements caused by speculation, news, and macroeconomic shifts. The BTCUSDT trading pair serves as one of the most liquid and closely monitored markets, making support and resistance crucial for strategic trading. Using technical analysis tools, traders can anticipate potential price reversals and continuations, allowing informed positioning in volatile environments. This article aims to explain how to identify, interpret, and apply support and resistance levels effectively in BTCUSDT markets.
Fundamentals of Support and Resistance
Support is a price level where buying interest is sufficient to halt or reverse a decline. When prices approach support, buyers typically step in, perceiving the level as a favorable entry point. Resistance, conversely, is a level where selling pressure dominates, preventing prices from advancing further. These levels are often influenced by trader psychology, past price behavior, and market sentiment. Static support and resistance remain relatively fixed over time, often anchored at round numbers, while dynamic levels, like moving averages or trendlines, change as prices evolve. Recognizing these distinctions helps traders adapt strategies for short-term swings or longer-term trends.
Price Psychology and Market Behavior
Market participants often treat support and resistance as self-fulfilling prophecies, reacting predictably when prices reach these zones. Positive or negative news, economic data, or regulatory announcements can amplify reactions at these levels. BTCUSDT, in particular, is sensitive to market sentiment, causing abrupt shifts near key support and resistance zones. Traders’ decisions reinforce these levels over time, creating recognizable patterns. Understanding the interplay of psychology and behavior allows for better anticipation of price action and reduces reliance on guessing.
Methods to Identify Support and Resistance in BTCUSDT
Historical price levels provide a foundation for identifying future support and resistance. Past highs and lows often act as reference points for traders deciding entry or exit zones. Trendlines, which connect sequential lows or highs, offer dynamic levels reflecting current market momentum. Moving averages provide smoothed price data, highlighting potential support or resistance within ongoing trends. Fibonacci retracement and extension tools are widely used to project turning points during corrections or trend continuation phases. Incorporating multiple methods increases confidence in the accuracy of identified levels.
Visual Tools and Chart Patterns
Candlestick formations help pinpoint support and resistance zones visually, revealing rejection wicks, hammer candles, and doji patterns. Classic chart patterns, such as head and shoulders or double top and bottom formations, offer strong confirmations of key levels. Volume analysis is equally essential, as high volume at a support or resistance zone indicates stronger conviction from buyers or sellers. Combining visual patterns with volume signals improves precision and reduces reliance on single indicators, helping to confirm genuine market behavior.
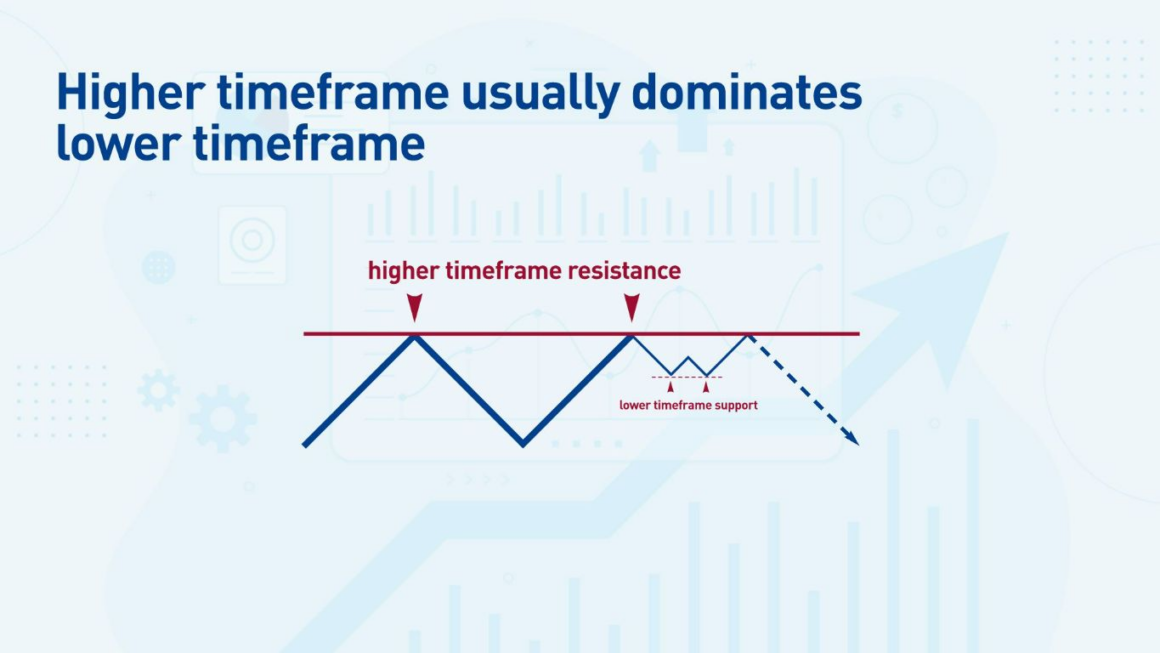
Timeframes and Their Impact on Support and Resistance
Short-term intraday support and resistance levels can fluctuate rapidly due to lower liquidity and high-frequency trading activity. Conversely, weekly or monthly levels are more stable, often reflecting significant investor sentiment. BTCUSDT reacts differently across timeframes, with short-term levels offering entry points for swing traders and long-term zones guiding institutional positions. Combining multiple timeframes enhances strategy precision, allowing alignment between immediate price action and broader trend context. This approach reduces the risk of reacting to insignificant fluctuations while capturing meaningful market moves.
Breakouts, Pullbacks, and False Signals
Breakouts occur when prices move decisively above resistance or below support, often signaling trend continuation. Pullbacks and retests provide opportunities to confirm the validity of a breakout before committing fully. False breakouts can trap traders, resulting in losses if trades are placed prematurely. Recognizing the difference between true and false breakouts requires observing price behavior, volume, and confirmation from additional indicators. Proper understanding of these dynamics ensures trades are executed at optimal levels and risk exposure remains controlled.
Risk Management Around Support and Resistance
Position sizing and stop-loss placement near critical levels protect capital from sudden reversals. Setting take-profit targets aligned with identified resistance or support zones optimizes gains while minimizing risk. Automated alerts and trading tools allow monitoring BTCUSDT in real-time, ensuring timely responses to breakouts, pullbacks, or trend changes. Consistent discipline in managing exposure helps maintain profitability even in volatile market conditions, reinforcing the strategic value of support and resistance.
Quantitative Analysis Tools and Support/Resistance
Indicators such as RSI, MACD, and Bollinger Bands enhance the analysis of support and resistance. RSI identifies overbought or oversold conditions, helping detect potential reversals at key zones. MACD confirms momentum strength or weakness, indicating potential breakouts or trend reversals. Bollinger Bands define dynamic support and resistance in highly volatile markets, while moving averages offer trend-based zones. Integrating these indicators strengthens confidence in market interpretation and reduces reliance on visual patterns alone.
Table: Common Indicators and Their Role in BTCUSDT Support and Resistance Analysis
|
Indicator |
Purpose |
How It Helps with Support/Resistance |
|
RSI |
Measures overbought/oversold |
Detects potential reversal at support/resistance |
|
MACD |
Momentum trend indicator |
Confirms breakout strength or trend reversal |
|
Bollinger Bands |
Measures volatility |
Identifies dynamic support and resistance zones |
|
Moving Averages |
Trend smoothing |
Highlights dynamic support/resistance levels |
Practical Tips for Applying Support and Resistance
- Combine historical levels with real-time order book data for enhanced precision.
- Use volume profile to validate strong support and resistance zones.
- Time entries and exits carefully to maximize profitability
- Focus on zones instead of single levels for better trading decisions.

How Zoomex Can Enhance Support and Resistance Trading
Zoomex, established in 2021, provides advanced tools for precise BTCUSDT trading. Spot, contract, and copy trading allow strategy implementation around critical levels. The platform offers advanced charting, low-latency execution, and a secure interface, enabling timely reactions to market movements. Users gain access to comprehensive market data, essential for detecting strong support and resistance zones while executing trades efficiently.
Key Features Beneficial for BTCUSDT Traders
- Comprehensive market data identifies high-probability zones.
- Security and reliability ensure safe execution near key levels.
- Flexible contract trading allows long or short positions based on analysis.
- Copy trading enables beginners to learn strategic responses to market signals.
Common Mistakes to Avoid in BTCUSDT Support and Resistance Trading
Mistaking minor fluctuations for strong levels can mislead traders. Ignoring volume and momentum reduces accuracy when confirming zones. Over-trading near minor support or resistance increases risk exposure. Sudden news or macroeconomic shifts can invalidate analysis, so factoring in external events is essential. Maintaining discipline and using confirmation tools mitigates these risks effectively.
Conclusion
Support and resistance are vital tools for navigating BTCUSDT and other volatile markets. Identifying levels through historical data, chart patterns, and technical indicators enables precise trading decisions. Combining multiple tools and timeframes strengthens accuracy, while disciplined risk management safeguards capital. Platforms like Zoomex enhance execution through advanced features, real-time data, and user-friendly interfaces. Mastery of support and resistance fosters confidence, improves market understanding, and elevates trading strategy effectiveness in cryptocurrency markets.


