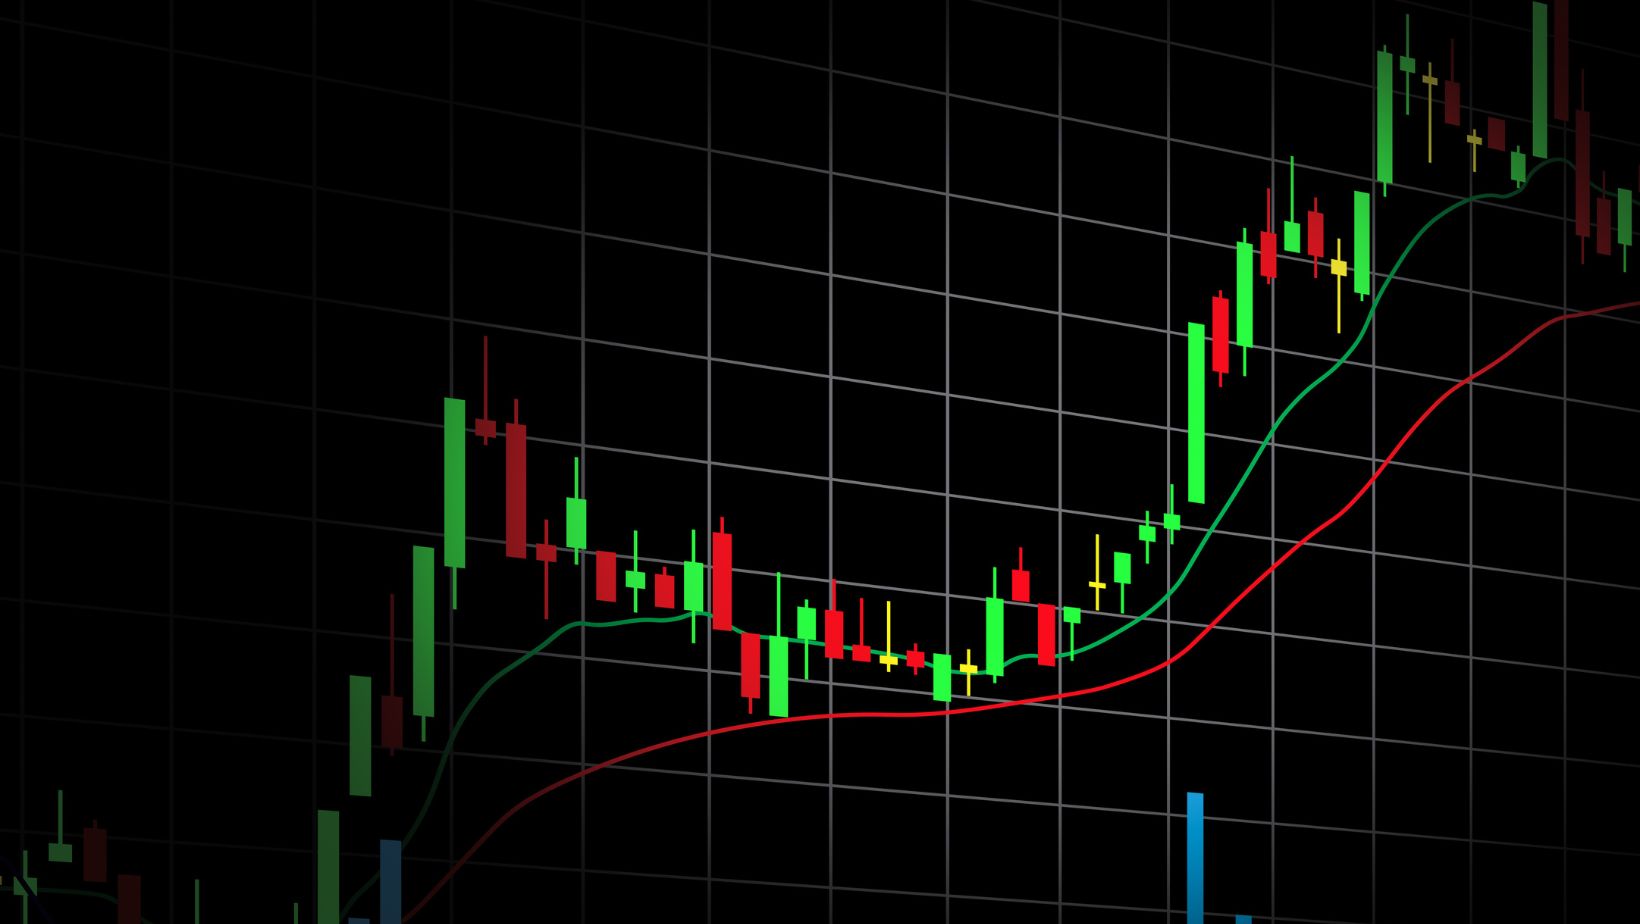
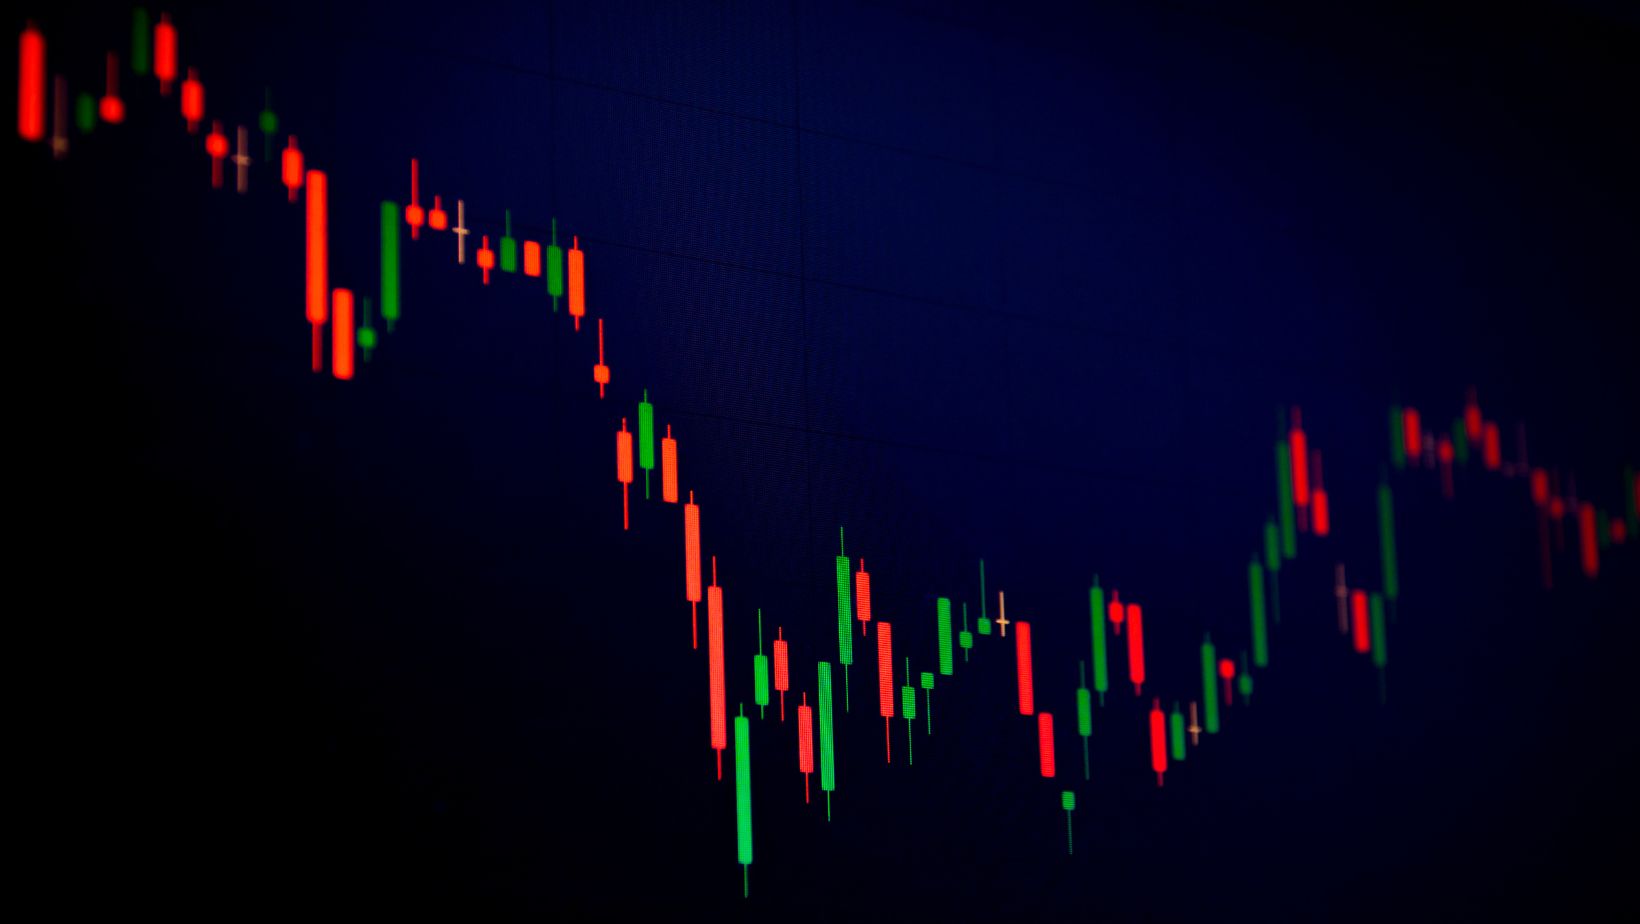
aIn the world of trading, patterns tell a story—one that, when read correctly, can reveal the future movements of markets with remarkable accuracy. Successful traders understand that beneath the surface of price fluctuations lie recurring patterns that hint at what might come next. By mastering these chart patterns, traders can gain an edge, making more informed decisions that go beyond mere speculation.
In this article, we’ll explore the power of chart patterns in predicting market movements, with a special focus on how candlestick patterns can be a crucial piece of the puzzle.
The Art of Identifying Patterns
Chart patterns are visual representations of the forces of supply and demand playing out in real time. They form the backbone of technical analysis, providing clues about potential future price movements based on historical data. From simple formations like triangles to more complex ones like head and shoulders, each pattern offers a unique insight into market psychology.
At the core of many chart patterns are candlesticks, which serve as the building blocks for more complex formations. For instance, the head and shoulders pattern—often indicative of a trend reversal—can be more accurately interpreted by examining the candlestick formations that make up the “head” and “shoulders.” A bearish engulfing pattern at the peak of the head might signal the impending downturn with greater certainty. By focusing on the candlesticks within broader patterns, traders can sharpen their predictive abilities.
Triangles: The Battle of Bulls and Bears
Triangles are among the most commonly observed chart patterns, representing a period of consolidation before a potential breakout. Symmetrical triangles suggest a balance between buyers and sellers while ascending and descending triangles indicate a prevailing trend.
When a price approaches the apex of a triangle, traders often anticipate a breakout.

Candlestick patterns can provide the final confirmation needed to act. For example, if a bullish candlestick pattern, such as a morning star, forms just before the price breaks above the resistance line of an ascending triangle, it could be a strong signal to enter a long position. Conversely, a bearish candlestick pattern at the end of a descending triangle might suggest a forthcoming breakdown.
Head and Shoulders: A Classic Reversal Signal
The head and shoulders pattern is a well-known reversal pattern that typically signals a trend change from bullish to bearish or vice versa. It consists of three peaks: a higher peak (head) and two lower peaks (shoulders).
While the head and shoulders pattern itself is a powerful indicator, candlestick patterns can add another layer of confirmation. For instance, the appearance of a hanging man candlestick at the top of the right shoulder could reinforce the likelihood of a bearish reversal. By integrating candlestick analysis into the recognition of head and shoulders formations, traders can improve the timing and accuracy of their trades.
Double Tops and Bottoms: Playing the Long Game
Double tops and bottoms are formations that indicate a potential reversal after a sustained trend. A double top suggests that the price has reached a resistance level it cannot overcome, while a double bottom indicates strong support.
The key to trading double tops and bottoms lies in recognizing the point at which the price fails to break through the resistance or support level. Here, candlestick patterns such as the evening star (in the case of a double top) or the bullish engulfing pattern (for a double bottom) can serve as early warning signals. By identifying these patterns at crucial points in the formation, traders can better anticipate and act on upcoming reversals.
Flags and Pennants: Continuation Patterns
Flags and pennants are short-term continuation patterns that indicate a brief consolidation before the trend resumes. These patterns are characterized by a sharp price movement followed by a period of consolidation in the form of a small rectangle (flag) or a small symmetrical triangle (pennant).
In a strong uptrend, a flag or pennant can signal a temporary pause before the price continues higher. Candlestick patterns within the consolidation phase, such as the bullish harami or a series of doji candles, can provide confirmation that the trend is likely to resume. Similarly, in a downtrend, a bearish candlestick pattern within the flag or pennant can suggest that the selling pressure is still strong.
Avoiding Common Pitfalls in Chart Pattern Analysis
While chart patterns can be powerful tools, it’s essential to exercise caution and avoid common pitfalls in their analysis. One common mistake is overreliance on patterns without considering other factors, such as fundamental analysis or market news. It’s important to remember that chart patterns should be used in conjunction with other indicators and tools to make well-informed trading decisions.
Furthermore, it’s crucial to practice proper risk management techniques. Setting stop-loss orders and adhering to predetermined risk-reward ratios can help protect trading capital and minimize losses in the event that a chart pattern fails to materialize as expected.
Advanced Techniques in Chart Pattern Analysis
As we progress in our journey of leveraging chart patterns, it’s beneficial to explore advanced techniques to enhance our trading strategies.
Combining Chart Patterns with Other Technical Indicators
By combining chart patterns with other technical indicators, we can gain deeper insights into market dynamics. For instance, pairing a bullish chart pattern with a confirmation from a momentum oscillator, such as the Relative Strength Index (RSI), can provide additional validation for a potential uptrend.

Similarly, using volume indicators alongside chart patterns can provide clues about the strength and validity of breakouts or reversals. By incorporating multiple indicators, we can strengthen our analysis and make more accurate predictions.
Adapting Chart Pattern Strategies for Different Market Conditions
Market conditions can vary greatly, with trends taking different forms in different financial instruments or timeframes. As seasoned traders, we must be adaptable and adjust our chart pattern strategies accordingly.
For example, in a highly volatile market, it may be more effective to focus on shorter-term chart patterns, such as triangles or flags, that can provide quicker trading opportunities. On the other hand, during periods of low volatility, longer-term chart patterns like Head and Shoulders or Cup and Handle can present more reliable signals.
FAQ: Recap of Key Points
- What are chart patterns?
Chart patterns are visual representations of price movements that help traders identify potential trends, reversals, and consolidation periods in the market.
- Why are chart patterns important in market analysis?
Chart patterns provide valuable insights into market sentiment and help traders identify potential entry and exit points.
- What are the different types of chart patterns?
Chart patterns can be categorized into reversal patterns (signaling a change in trend) and continuation patterns (suggesting the existing trend will continue).
- How do chart patterns indicate market trends?
Chart patterns reveal the prevailing market sentiment and help traders identify trends through patterns like ascending triangles for uptrends and descending triangles for downtrends.
- How do traders leverage chart patterns?
Traders can leverage chart patterns by identifying profitable ones and avoiding common pitfalls in analysis, such as overreliance or neglecting risk management.
- What are advanced techniques in chart pattern analysis?
Advanced techniques involve combining chart patterns with other technical indicators and adapting strategies for different market conditions.
- What does the future hold for chart patterns?
Technology will continue to impact chart pattern analysis, with automated trading systems and evolving trends shaping the future of trading.
Conclusion
Chart patterns offer traders a powerful tool to predict market movements, but the real strength lies in the details. By incorporating candlestick patterns into your analysis, you can gain deeper insights and make more accurate predictions. Whether you’re identifying potential breakouts, anticipating reversals, or confirming continuations, the combination of chart and candlestick patterns can elevate your trading strategy. Remember, in trading, the devil is in the details, and mastering these patterns can give you the edge needed to succeed in the markets.


